In recent years, mean kinetic temperature (MKT) has been identified as a potential tool for evaluating the impact of temperature on product quality. However, the calculation can be difficult, and is often misused.
MKT was first proposed to guide stability studies and is now considered useful for understanding temperature excursions in GDP-compliant applications. The math is tough, and there is currently no consensus on how the calculation should be applied.
Paul Daniel from Vaisala answers a few questions that are often received on using mean kinetic temperature.
Five questions, about a recent temperature study of three warehouses at a certain nutraceutical distribution center, were thrown at Paul. A “historical data report” was generated using the Vaisala mapping software, however some uncertainties have surfaced on what numbers were needed and how to correctly read the report.
Question 1:
“First, in the software we noticed … that we can change the MKT activation energy, which changes the MKT value in the report. But, here our interpretation is fuzzy. What exactly is the activation energy value and what should it be set at? “
Answer:
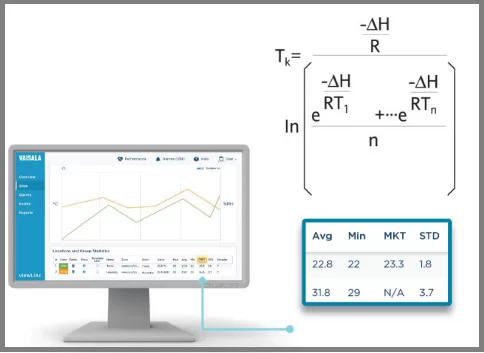
“By default, the MKT activation energy should be set at 83.144 kJ/mo. This value was historically selected as the customary value for GMP reporting because it made the math a lot easier (for manual calculations), and it is a representative of reaction rates for zero order thermal degradation of most biological molecules at ambient temperatures. So, unless you have done a study to determine a more representative value for a specific product, stick with this default value. See this application note for more information about the calculation of MKT.”
Question 2:
Second, in the report there are two columns labeled as Groups. What are these columns indicating?
Answer:
The “Groups” columns simply indicate that these statistics are the statistics for a selected group, usually all the temperature channels included in the report.
Question 3:
Third, there is an MKT value on line 54 and a Min MKT value at line 68. Is there a Max MKT value?
Answer:
The MKT value on Line 54 is for that particular temperature channel only – in this case, Logger 1 / Channel 1. The value on Line 68 is the lowest MKT score for the group included in the group statistics. However, since your group consists of only one logger, the value is the same. When reporting on single loggers, it is recommended to not include group statistics in your report.
The max MKT value is not missing. There is no max MKT value. It is rather the presence of the Min MKT value is a historical error. We should not have included it in the group statistics in the first place. There are two reasons for it:
a) Its inclusion was based on us simply following the reporting characteristics of another calculated value – Lethality (FO) – in which the minimum is important.
b) MKT is generally not a reported value for a group, but is reserved for investigation of excursions, as you can’t have a problem with MKT unless you already have a problem with your temperature values.
Question 4:
Fourth, which MKT value is the correct one to use in our trending reports?
Answer:
To answer your question about the correct value to use in your reports, I would need to know more about your application to make recommendations on how to trend your MKT values. Remember that the MKT itself is a logarithmic weighted average already for each space over time, so there is little use in averaging MKT across different spaces.
But, if you do report MKT for Trending, it should be for each individual sensor using a time frame for that calculated value that matches the average time an item is stored in your warehouse (such as 14 days or 30 days). You could then present the MAX MKT values for a given location over the course of the year, but this measurement isn’t intended to be a performance indicator.
Question 5:
Finally, as stated, we are performing temperature studies every quarter of 2016 on three different warehouses. If we want to trend the MKT data over the course of year, is it best to take the average of all MKT scores to find a global average or is there a better calculation for trending the MKT score?
Answer:
Recall that MKT is an investigative tool for evaluating high-side temperature excursions in well-controlled room temperature environments. I would caution against using it for anything else, as it can hide actual operational problems. I would instead focus on maximum temperatures and the number + duration of high-side excursions for each warehouse. Then I would look for the highest excursions and longest excursions, and provide an MKT value from the worst location to inform the audience about the averaged impact of the excursion.
More Questions? Contact us!
(Article courtesy of Vaisala)


Nice information about MKT! Everyone in cold chain industry should be aware that you need to have Mean Kinetic Temperature (MKT) Calculation Real-time