People often assume that when they install a solar PV system, they will automatically save a lot of money on their electricity bills. However, the savings are often misunderstood and miscalculated, leading to disappointing results once the PV system is up and running. Before buying a PV system, it’s important to fully understand where the benefits lie, depending on household energy usage and location.
Let’s explore the typical power usage patterns of households in Australia, and compare them to the power generated by different-sized rooftop PV solar systems. This can help you understand the potential savings
that can be achieved from rooftop solar, and the limitations of using solar to power your household.
Energy generation versus consumption
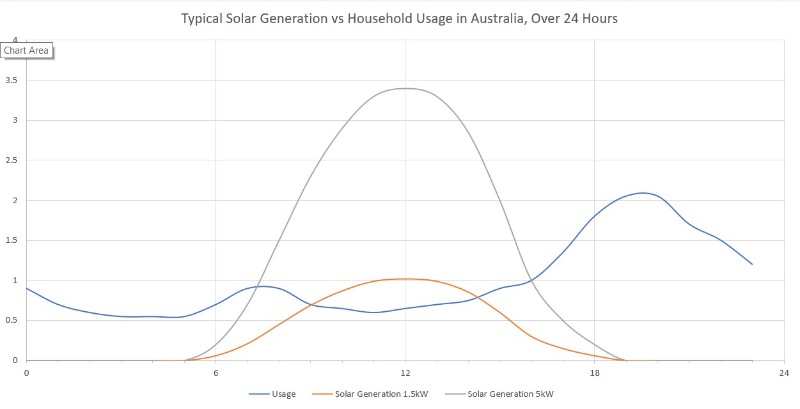
The below graph shows three curves, covering a 24-hour period. (Note we have used “average” figures across all seasons).
1) Typical household electricity consumption (blue line in the graph)
2) The ability of a 1.5kw grid-connected solar PV system to generate electricity (orange line)
3) The ability of a 5kw grid-connected solar PV system to generate electricity (grey line)
You
can see there are many times when the solar
generates more power than the household uses. Then there are
times (evenings mainly) when usage is high, but the solar
is not generating power because the sun isn’t shining. Every
household will have different usage patterns and amounts though – the graph
is an example.
At times when the solar generation line (orange or grey) goes higher than the (blue) consumption line, we can assume that 100% of the household power usage is coming from solar. So power during that daytime period is effectively free.
Feeding excess solar energy back to the grid can also result in a reduction on your electricity bill, if your supplier pays a feed-in tariff. The amount you get paid for feeding power into the grid can vary widely, depending on your location and your electricity retailer and plan.
However, as more and more households install solar, electricity providers are starting to have problems with too much solar power generation in the grid during the day, which contrasts with the high loads experienced in the evenings. This means feed-in tariffs may reduce over coming years.
Note that kilowatts (kW) are a measure of instantaneous electricity usage or generation, while kilowatt hours are a measure of the total cumulative electricity usage/production over time. The above graph represents kilowatts, ie. the amount of power being generated or used at each instant. But your electricity bill is measured in kilowatt-hours (kWh), which is the total energy used over time.
Kilowatt-hours can be calculated as follows: the kilowatts being used, multiplied by the hours that you used that kW amount over. If you run a 2kW air conditioner for two hours, your billed usage will be 2kW x 2h = 4kWh. However most kW usage will vary from moment to moment, so unless you install a data logger or smart meter to record the usage over time, it’s very difficult to get a meaningful profile of your consumption.
Typical 1.5kW solar PV systems
The graph shows that a 1.5kW solar PV system (orange line) will produce a little more electricity than the average household’s demand (blue line) during the middle of the day. For the rest of the day however, the average household will likely use more power than the solar PV cells can generate.
For households that receive a feed-in tariff, a home with this kind of consumption pattern and a 1.5kW solar PV system could end up with very little rebate, as most of the solar energy would be used by the household. But power consumption could still be reduced, especially if usage patterns can be adjusted to take advantage of the solar generating hours. For example a pool filter pump or an electric hot water system could be set to only turn on between 10am and 2pm.
Typical 5kW solar PV systems
The grey line in the graph represents the power generation by a 5kW grid connector solar PV system. You can see that this system’s power generation exceeds the power usage of the household for a significantly longer time (approx nine hours) compared to the 1.5kW system. You can also see that the majority of the power generated by this system would be exported back to the grid, as the household’s usage pattern does not line up with the peak solar power generating hours.
This system has the potential to produce significant electricity bill savings, but the total amount of money saved will depend largely on what feed-in tariff is provided by the electricity retailer.
Getting the most out of solar
So how can households make sure they optimise the benefits of solar PV systems?
Consider adding a battery
For larger solar PV systems, it’s worth considering installing a battery system as well. These will store the excess solar power generated during the day, and provide the power to the household in the evening/morning peak times. This will give you the best electricity bill saving, as you’re making full use of the solar energy you’re producing, and not depending on the feed-in tariffs.
Know the feed-in tariffs
To get maximum benefit from a solar PV system, a thorough understanding of regular power usage and the feed-in tariff scheme is essential.
Your electricity provider can advise on what feed-in tariffs they offer, and you can compare providers on websites such as Canstar Blue.
Work out electricity usage
To size up a PV system and decide whether to add battery storage, it’s
essential to know how much electricity your household uses in a 24-hour period. This can vary depending on things like:
- Whether air conditioning is installed, and what type of air conditioning system.
- Whether electric heating is used.
- Other electric appliances that are used every day, including cooktops, ovens, dryers, washing machines, fridges, pool pumps, lighting, etc.
- Habits of the occupants, for example do they typically run the air conditioning for two hours a day in summer, or 10 hours, or 24 hours? Is it only run in the bedroom, or throughout the whole home?
The only way to get a true understanding of your usage is to measure it over a couple of weeks using a power data logger temporarily installed in the fuse box. This can help determine the right size system, and also identify where you can cut usage, adding up to more savings.
A data logger will generally need to be installed and removed by a licensed electrician. If your electrician or solar installer doesn’t already have a power data logger, please contact Esis to find out how your electrician can hire or purchase one. We’ll also provide support for first-time users in how to download and interpret the electricity data. A data logging session is worthwhile for any homeowner – not only will you avoid wasting money on a wrongly-sized solar PV system, but the electricity savings that are identified will keep adding up year after year.
Please contact us to discuss your data logging needs.


